Overview
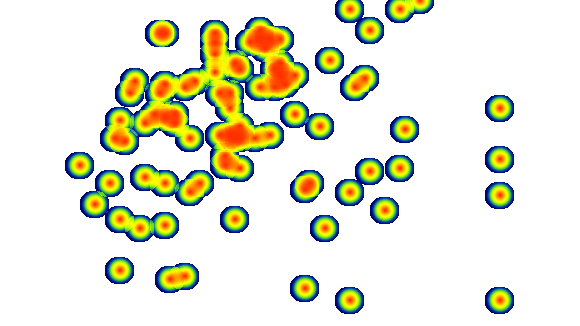
The MatchPlayerHeatmap endpoint can return a rendered heatmap image for a player during a match. Instead of returning raw coordinate data, this request generates a visual heatmap image with a transparent background, showing the areas where the player was most active on the pitch. The heatmap intensity represents frequency of activity:- Red zones indicate the highest activity
- Yellow/green zones represent medium activity
- Blue zones represent lower activity
- Broadcast graphics
- Tactical analysis reports
- Scouting dashboards
- Match analysis tools
Parameters
Module API fixed and cannot be changed. Always use
api.Endpoint name. Use
MatchPlayerHeatmap.API version. Use
V2.Unique identifier of the match.
Unique identifier of the player.
Set this parameter to
image to return the rendered heatmap image.Width of the generated image in pixels.
The height is automatically calculated to preserve the image aspect ratio.
The height is automatically calculated to preserve the image aspect ratio.
Controls the heat intensity radius of each activity point.
Allowed values:
Allowed values:
32, 50, 100.API authentication key.
Example Request
Response
The response is a PNG image with transparent background representing the player heatmap.Notes
- The image background is transparent, making it easy to overlay on pitch graphics.
- Heat colors represent activity density, with red indicating the highest activity zones.
- Increasing
dot_sizewill produce larger and smoother heat clusters. - The height is automatically calculated based on the pitch aspect ratio.
- This endpoint is commonly used for visual match analysis and broadcast graphics.