Expected Goals (xG)
Introduction
Expected Goals (xG) is a statistical model designed to estimate the probability that a given goal-scoring opportunity will result in a goal. Instead of evaluating match outcomes only through the number of goals scored, the Expected Goals model evaluates the quality of scoring opportunities created during a match. Each shot is assigned a probability value between 0 and 1, representing the likelihood that the attempt results in a goal. For example, a shot taken from a long distance with several defenders in front of the goal typically has a very low probability of resulting in a goal. Conversely, a shot taken close to the goal with a clear view of the goal mouth usually has a much higher probability of success. By assigning probabilities to individual shot events, the Expected Goals model provides a more reliable way to evaluate attacking performance. It allows analysts to distinguish between teams that consistently create high-quality opportunities and teams that rely on low-probability shots. At KoraStats, the Expected Goals model was developed using historical match data and statistical modeling techniques to estimate the probability that a shot results in a goal. The model is based on the analysis of several characteristics describing the shot event and the situation in which it occurs.Data and Dataset
The Expected Goals model was developed using match data collected from the Egyptian Premier League. The dataset contains goal-scoring opportunities recorded across four seasons of competition. Each observation in the dataset represents a single shot event taken during a match. The dataset contains a total of 25,716 shot events.| Season | Number of Events |
|---|---|
| 2015 / 2016 | 6,668 |
| 2016 / 2017 | 7,026 |
| 2017 / 2018 | 7,109 |
| 2018 / 2019 | 4,913 |
- shot location on the pitch
- type of scoring opportunity
- contextual match information
- outcome of the shot (goal or no goal)
Methodology
The Expected Goals model was implemented using logistic regression, which is commonly used for binary classification problems. In the context of Expected Goals modeling, each shot event can produce one of two possible outcomes:| Outcome | Description |
|---|---|
| Goal | The shot resulted in a goal |
| No Goal | The shot did not result in a goal |
| Symbol | Meaning |
|---|---|
| P(goal) | probability that the shot results in a goal |
| β0 | intercept |
| β1 … βn | regression coefficients |
| X1 … Xn | model variables |
Distance to Goal Mouth
One of the most important variables used in the model is the distance between the shot location and the goal mouth. The center of the goal is defined as the coordinate:(x, y), the distance to the goal mouth is calculated using the Euclidean distance formula:
Distance has a strong influence on the probability of scoring. As the distance between the shooter and the goal increases, the probability of scoring decreases.
Instead of using the raw distance directly, the model uses the logarithm of the distance, which provides better statistical behavior for the regression model.
Shooting Angle
Another important variable is the shooting angle, which represents how much of the goal mouth is visible from the position of the shot. The shooting angle is defined as the angle between the lines connecting the shot location to the two goal posts. The coordinates of the goal posts are defined as:| Variable | Description |
|---|---|
| dL | distance from shot location to the left post |
| dR | distance from shot location to the right post |
Angles Buckets
The diagram should show:- the shot location
(x,y) - the left goal post
(50,4) - the right goal post
(50,-4) - the two lines connecting the shot to each post
- the angle between those lines
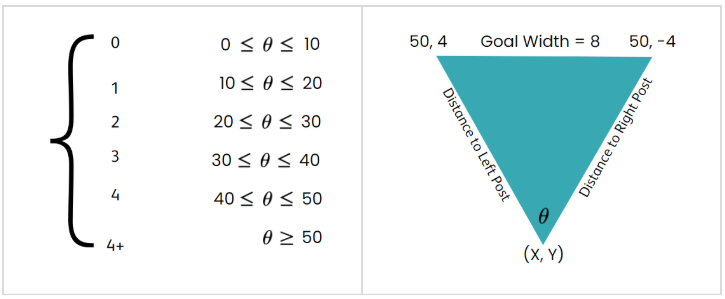
Angle Buckets
To better capture the relationship between shooting angle and scoring probability, the model groups angles into discrete ranges known as angle buckets.| Bucket | Angle Range |
|---|---|
| 0 | 0° – 10° |
| 1 | 10° – 20° |
| 2 | 20° – 30° |
| 3 | 30° – 40° |
| 4 | 40° – 50° |
| 4+ | ≥ 50° |
Chance Type Variables
The model also incorporates several binary variables describing the type of scoring opportunity. Each variable takes the value:| Variable | Description |
|---|---|
| isHeader | shot was taken with the head |
| isPenalty | shot resulted from a penalty kick |
| isOneOnOne | player was in a one-on-one situation with the goalkeeper |
| isFreeKick | shot resulted from a direct free kick |
Summary
The KoraStats Expected Goals model was developed using historical match data from several seasons of the Egyptian Premier League. The model estimates the probability that a shot results in a goal using logistic regression and a set of variables describing the characteristics of the scoring opportunity. Key variables used by the model include:- distance to the goal
- logarithm of the distance
- shooting angle
- angle bucket classification
- type of scoring opportunity