Overview
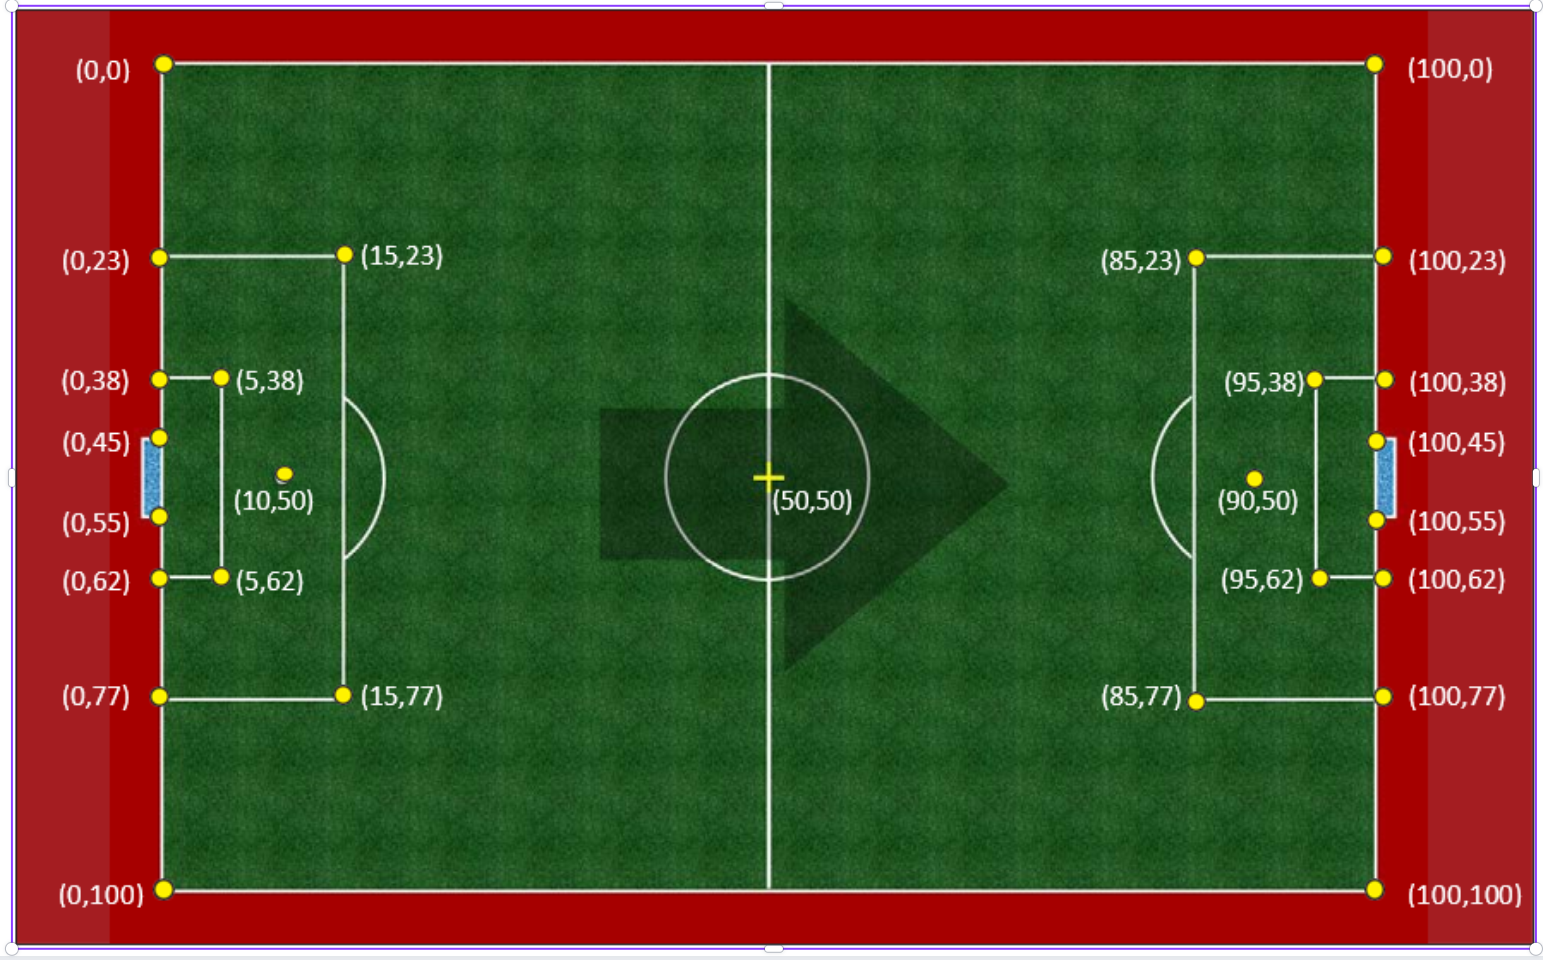
The KoraStats pitch model uses a normalized coordinate system ranging from 0 to 100 on both axes.
This allows every event location to be expressed consistently regardless of the real stadium size.
The pitch is represented as a 2D plane where:
- The X-axis represents the length of the pitch
- The Y-axis represents the width of the pitch
The attacking direction is defined from left to right.
Coordinate System
The pitch uses a Cartesian coordinate system with the origin located at the top-left corner of the field.
| Coordinate | Description |
|---|
(0,0) | Top-left corner of the pitch |
(100,0) | Top-right corner of the pitch |
(0,100) | Bottom-left corner of the pitch |
(100,100) | Bottom-right corner of the pitch |
Axes
X-axis
Represents the horizontal movement along the pitch length.
0 → Defensive goal line100 → Opponent goal line
Y-axis
Represents the vertical movement across the pitch width.
0 → Top touchline100 → Bottom touchline
Center of the Pitch
The center of the pitch is located at: (50,50)
This coordinate corresponds to the center spot where kick-offs take place.
The center circle is drawn around this point.
Pitch Boundaries
The playable area is defined by the following corner coordinates:
| Corner | Coordinate |
|---|
| Top Left | (0,0) |
| Top Right | (100,0) |
| Bottom Left | (0,100) |
| Bottom Right | (100,100) |
Penalty Areas
Left Penalty Area
The penalty area in front of the left goal is defined by the following coordinates:
| Description | Coordinate |
|---|
| Top-left corner | (0,23) |
| Top-right corner | (15,23) |
| Bottom-right corner | (15,77) |
| Bottom-left corner | (0,77) |
Right Penalty Area
The penalty area in front of the right goal is defined by:
| Description | Coordinate |
|---|
| Top-right corner | (100,23) |
| Top-left corner | (85,23) |
| Bottom-left corner | (85,77) |
| Bottom-right corner | (100,77) |
Goal Areas
Left Goal Area
The smaller goal area (6-yard box) near the left goal is defined by:
| Description | Coordinate |
|---|
| Top-left corner | (0,38) |
| Top-right corner | (5,38) |
| Bottom-right corner | (5,62) |
| Bottom-left corner | (0,62) |
Right Goal Area
The goal area near the right goal is defined by:
| Description | Coordinate |
|---|
| Top-right corner | (100,38) |
| Top-left corner | (95,38) |
| Bottom-left corner | (95,62) |
| Bottom-right corner | (100,62) |
Penalty Spots
Each penalty spot is located inside its respective penalty area.
| Location | Coordinate |
|---|
| Left Penalty Spot | (10,50) |
| Right Penalty Spot | (90,50) |
Halfway Line
The halfway line runs vertically across the pitch at: X = 50
This divides the pitch into two equal halves.
Center Circle
The center circle is centered at: (50,50)
It surrounds the kickoff spot and defines the minimum distance opponents must keep during kickoff.
Goals
Two goals are located at the center of each goal line.
| Goal | Location |
|---|
| Left Goal | Centered on (0,50) |
| Right Goal | Centered on (100,50) |
Direction of Play
By convention within the KoraStats system:
- The attacking direction moves from left to right
- The defending team protects the left goal
This standardization allows consistent analysis of:
- attacking patterns
- shot locations
- possession progression
- final third entries
Summary
The normalized pitch model provides a consistent spatial framework for representing match events.
Key characteristics:
- Coordinate range:
0 → 100
- Origin:
(0,0) top-left corner
- Center:
(50,50)
- Attacking direction: left → right
This model allows all events such as passes, shots, carries, and defensive actions to be recorded with precise spatial references.